Condition monitoring software
Condition monitoring that finishes the job.
RADAR brings together the visit, the instrument data and the report. Engineers collect on a phone or tablet, analysts work on the real signals, and clients get a clear answer on the condition of every machine.
Vibration, visual inspection and watchkeeping, in one system. Test logins open a working copy filled with example data.
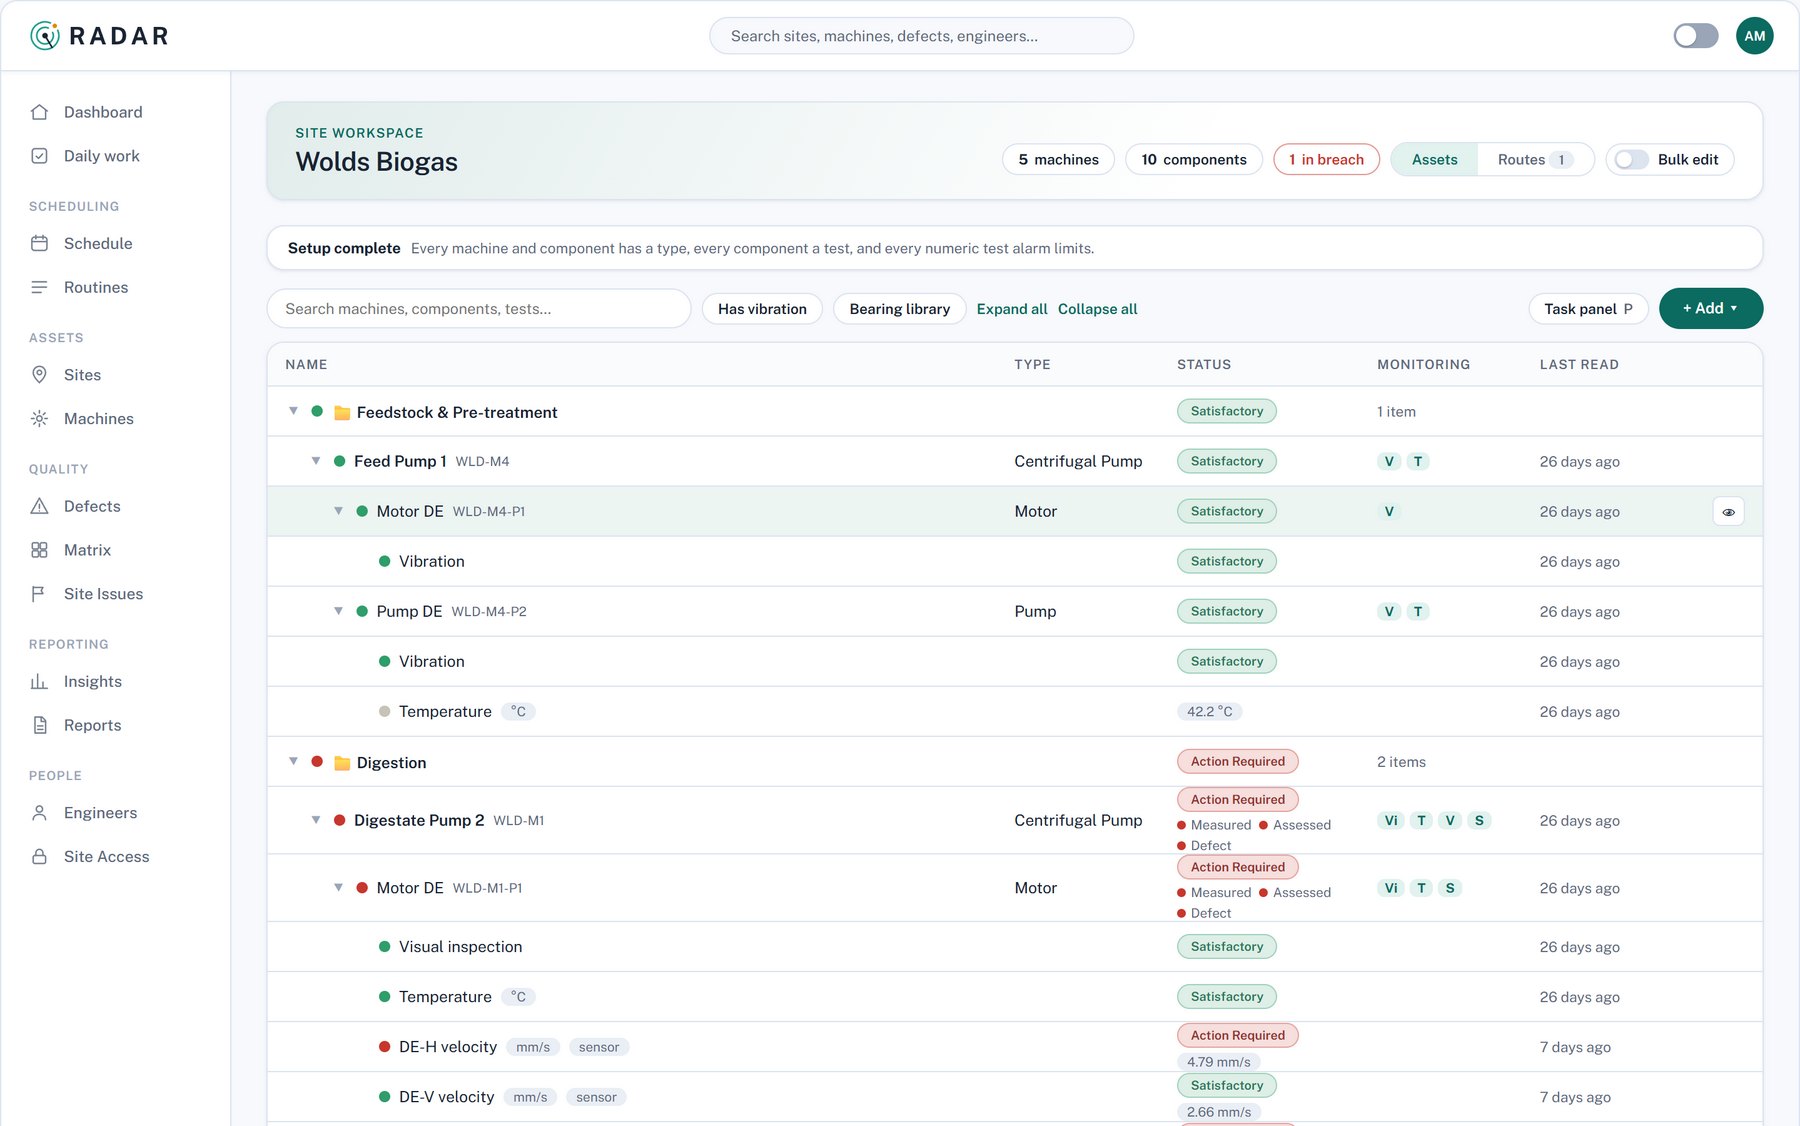
The problem
Condition data is easy to collect and hard to use.
Readings sit in one tool, inspection notes in another, instrument trends in a third, and the report is written by hand at the end. By the time it reaches the person who has to decide, the answer is a week old and nobody can say where the number came from.
RADAR keeps every step connected, so the result on the report traces straight back to the reading.
How it works
Four steps, one thread.
Plan
Sites, machines and components, organised in folders. Routes and a schedule decide who visits what, and when.
Collect
Engineers record visual inspections and numeric readings on a phone or tablet, in the field, with or without signal. Instruments feed readings in automatically.
Analyse
One condition for every component, built from the visit, the instruments and any open defects. Analysts open the spectrum, waveform and trend behind it.
Report
Branded reports for the client, a live condition view for the site, and the defects that need action, with the evidence attached.
What it does
Everything between the walk-round and the decision.
One condition per machine
Every machine and component shows a single, explained condition: worst of the latest visit, the instruments and open defects. It always says which of the three set it.
Field collection that works offline
Visual inspection, watchkeeping and vibration readings on a phone or tablet, saved on the device and sent when there is signal. Nothing is lost between the plant room and the car park.
Analysis tools for real signals
Trend, spectrum, waveform and waterfall, with order tracking, markers, harmonics, sidebands and bearing fault frequencies drawn on the chart.
Defects with evidence
Raise a defect from the reading. The chart you were looking at goes with it. Suggested wording per asset type and severity keeps reports consistent.
Reports that look finished
A branded cover with your logo, a clean running header, status summaries and the defects that matter. Templates are yours to edit.
Insights across the estate
Machines by status, instrument health, what is getting worse, what has gone quiet, and where limits need a second look.
Instruments
Your instruments, your limits, one place.
RADAR takes readings and waveforms from your monitoring system and scores them against limits you set in RADAR, per channel. It connects through an API connection to any compatible analyst software, and RADAR's own hardware will connect the same way.
A small desktop app sits on the site network, reads from the monitoring system and keeps RADAR up to date. Keys are encrypted on the PC and it only ever reads.
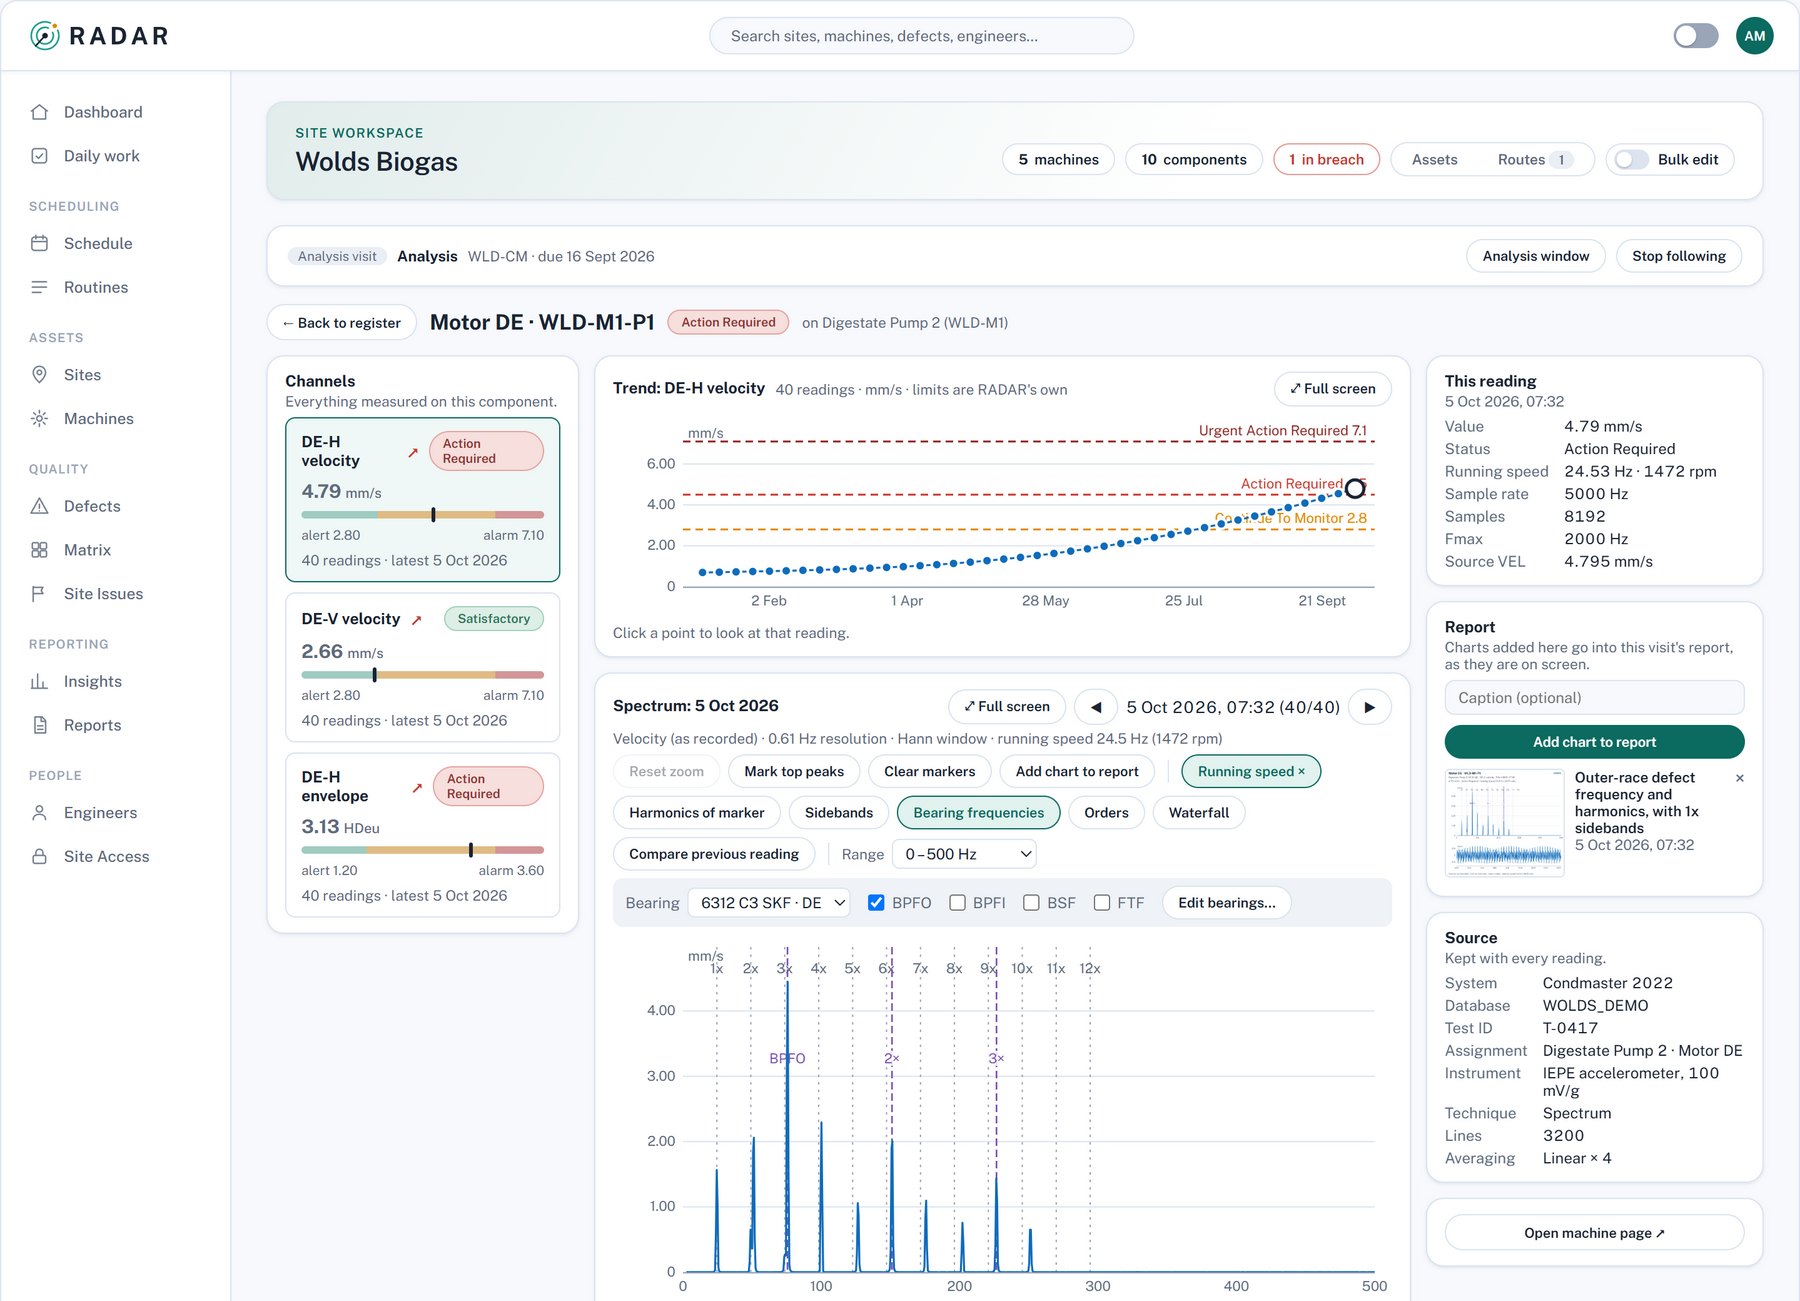
A motor drive-end bearing on example data: the trend rises through its limits, and the spectrum shows the bearing's outer-race frequency and its harmonics.
Reports
From analysis to a report you are happy to send.
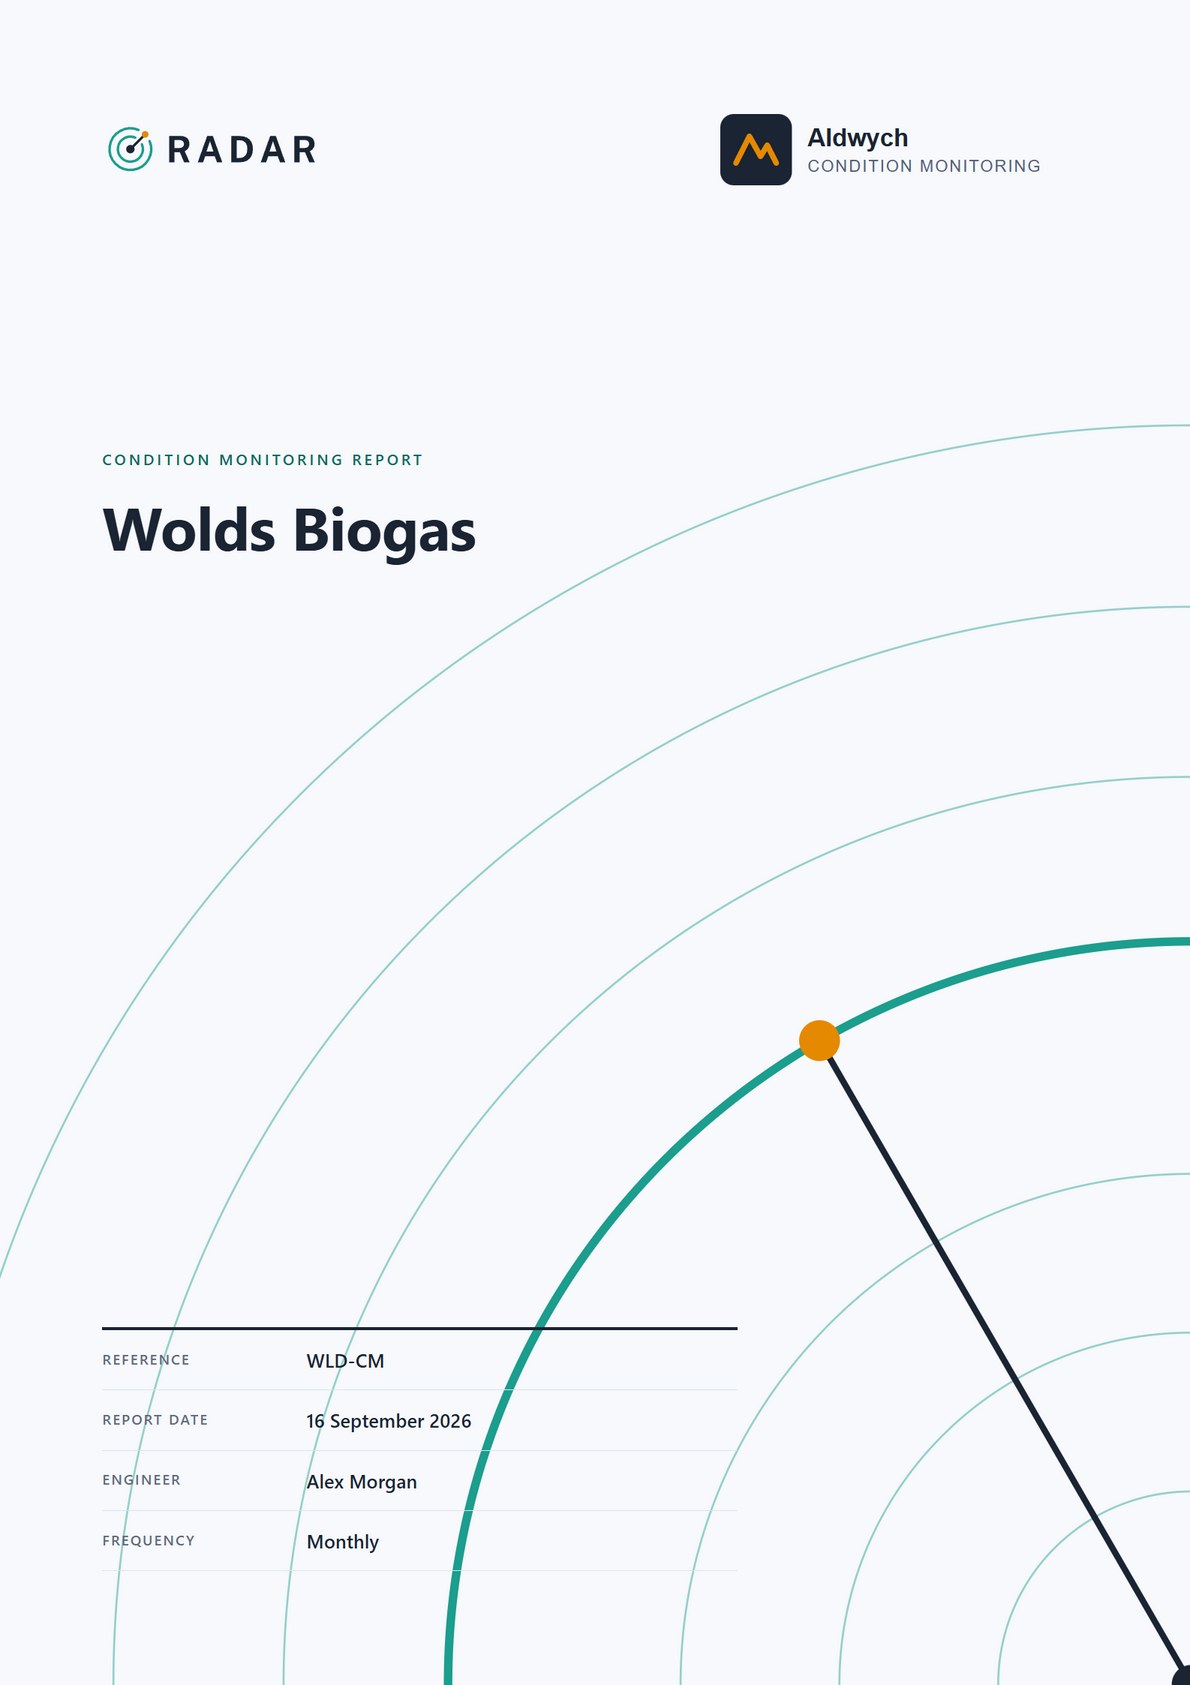
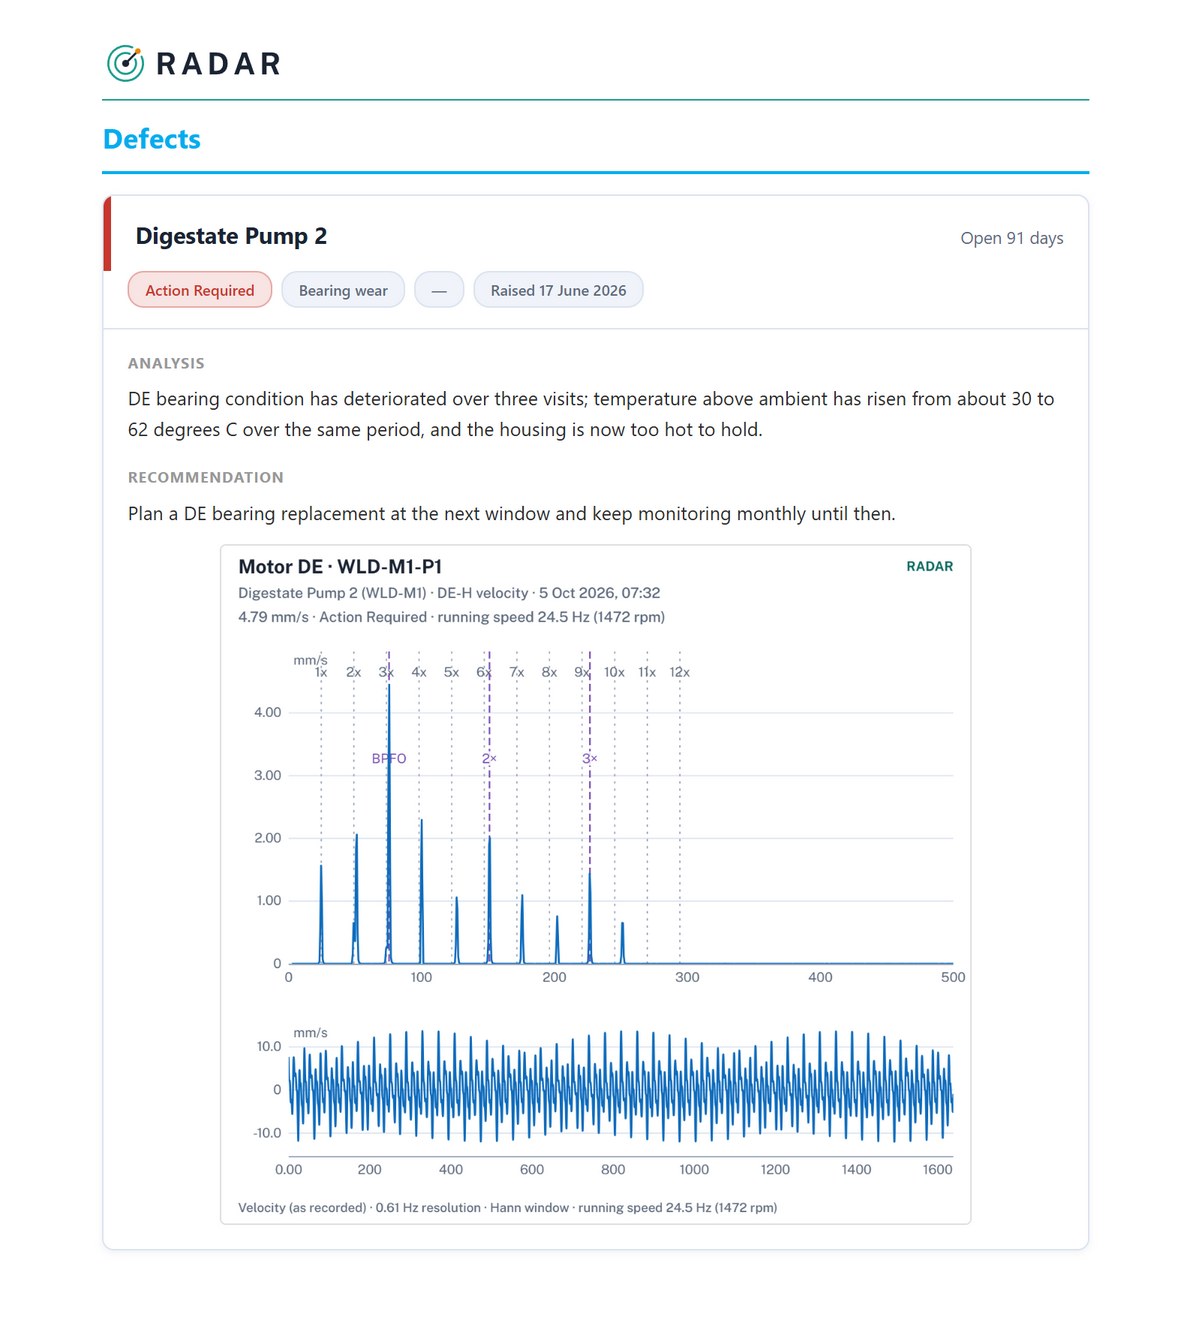
Visit reports and single-asset reports, with your own logo on the cover, the condition summary at the front, and every defect with its picture, its analysis and its recommendation. Choose the sections, the layout and the accent colour once; every report follows.
For your clients
Give clients the answer, not a login to everything.
Clients sign in to a read-only view of their own sites: the current condition of each machine, the defects that are open, and the reports. Staff-only analysis and notes stay with you.
Security and ownership
Your data stays yours.
Your own deployment
Each customer has a separate database and website. Nothing is shared between customers.
Access by role
Staff, administrators and client users each see only what they should, enforced in the database itself.
Signs people out
Sign-in ends when the browser closes and after a period of inactivity, so a shared PC does not hand over an account.
Keys stay put
Connection keys are encrypted by the operating system and are never shown again once saved.
Built for
The people who make the call, and the people who make the visit.
Condition-monitoring consultancies running routes across many client sites.
In-house reliability teams who want inspection and instrument data in one place.
Site operators who want a clear, current picture without learning the tools.
Request a test login
Try it with real-looking data.
A test login opens the working system, filled with three fictional biogas plants: a year of monthly visits, ambient conditions, defects and reports. Open a machine, follow a defect back to the reading, see the report it ends up in. Nothing you do affects anyone else, and the examples are put back each night.
Questions
Before you ask.
What does it connect to?
An API connection to any compatible analyst software. RADAR's own hardware follows, using the same connection.
Does it work without a signal?
Field collection does: readings are kept on the device and sent when it is back online.
Who owns the data?
The customer. Each customer's data lives in its own database.
Can we use our own branding?
Yes: your own logo goes on the cover of every report, and the accent colour is set in the template.
Is it only for vibration?
No. Vibration, visual inspection and watchkeeping readings are all handled, with defects drawn from any of them.
How do we get started?
Request a test login to look around first. When you are ready, your company is set up as its own deployment and your monitoring system is connected with RADAR Connect.
Can I break anything in the test login?
No. It is a separate copy with example data, and it is reset regularly.